
日本語のページもあります。
This page is about Accelogger-simple accelerometer logger for Android application. I'm sorry written in my bad English.
| Version | date | What's new |
|---|---|---|
| 2.6 | 2010-09-10 | You can select delimiter of logs. |
Accelogger is logger and viewer of acceleration. After launch this app you can see the alteration of acceleration from moment to moment.
If you want sampling data, it is very easy! Only you have to do is clicking REC button. In automaticlly this app will makes numerical log file of acceleration vector in following folder that is in your SD-card.
/accelogger/
Do you know the maximum acceleration of elevators?
Do you know the average acceleration on the edge of your fingers duaring walking?
Do you know the major frequency of walking, cycling or dancing?
All these questions are able to figured out by this application and your android!
You can see the following elements.These elements are able to add/delete by setting.
You can log the following elements.These elements are able to add/delete by setting.
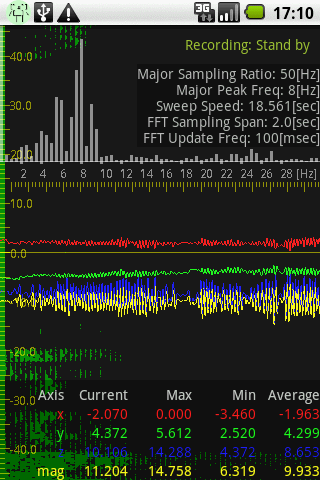
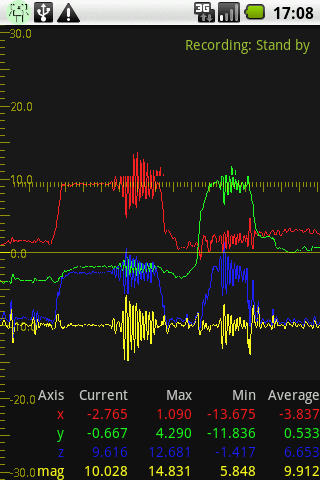
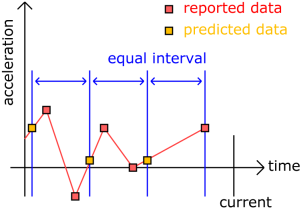
Trend of Acceleration. Red:x, Green:y, Blue:z, Yellow:mag that is length of vector (x,y,z). The sampling rate is depend on your device. Usually 50[Hz] (in every 20msec). But it is not regular interval. For example, sensor reports frequently when detects the quick motion, and doesn't reports any data when it quite stable. The major sampling freqency is able to shown in extra Info.
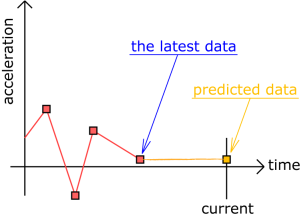
The application plots data on level-time plane. If there are no reported data in recent seconds, the application predicts that it was no change, and extrapolats by the last reported data.
The log file is named as WV-yyyyMMdd-HHmmss.txt in CSV. The first column is date and time. The seconds is relative time in nano seconds. The 3rd,4th and 5th are corespond to x,y and z values in m/sec2. These values are not predicted. They are raw data.
Axis of wave on the level-time plane. You can change the scale by sliding on your screen. The maximum level is limited at 40.0. The time scale marks is in seconds. These axis are shown when the wave is shown. Span of time axis is able to shown in extra Info. as Sweap Speed.
Distribution of length of vector for each frequency.
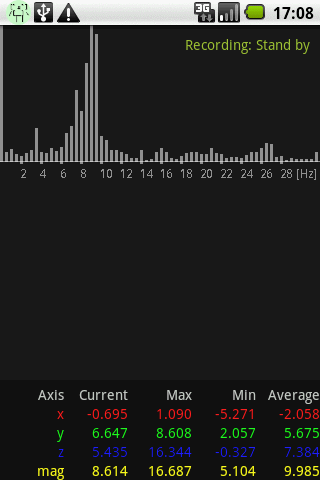
It is calculated by FFT (Fast Fourier transform). The frequenciy span is 0 to 31 25 Hz. The hight on screen is scaled by the scale of wave axis. Frequency of the major peak is able to shown in extra Info. The count of data is 128, and the time span for sampling is 2.56 seconds. Thus the required sampling rate is actually 50[Hz] (in every 20 msec). But for some reasons, there are several lacking of data, so the application predicts the values for every equal intervals. Note: According to the restriction of the algorithm this prediction is started from the latest data to the past for 2.56 seconds. So, if it has been reported no data in recent several seconds, the spectrum is not current one.
The log file is named as SP-yyyyMMdd-HHmmss.txt in CSV. The first column is date and time. The seconds is relative time in nano seconds. The 3rd to the last are corespond to the norm of complex intensities of 0 to 31 Hz.
The spectrum is updated in every 100msec if possible. You can change this valus in the setting page.
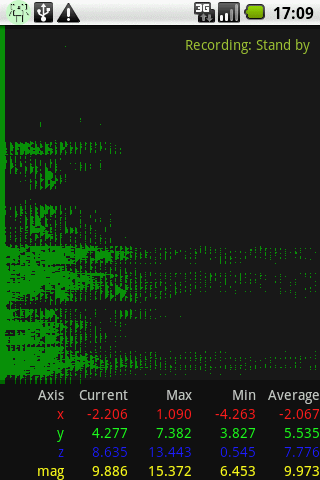
Time dependend distributions of spectrum. It is also calculated by FFT. The abscissa axis is same as the spectrum. The vertical axis is time (up is future). 1 pixel coresponds to 1 FFT update cycle. So if you changes the update frequency, the vertical scale is also changed. The width of green fallings corespond to the peak height for each frequency.
The log file is named as WF-yyyyMMdd-HHmmss.png in Graphically. The filename indicates the timestamp when this image saved.
Proportional value of Vibration Energy of your device. It is also calculated by FFT as the following equation.
PVE := Sigma ( freq2 * amplitude2 / sampling time span ).※
PVE := Sigma ( freq2 * amplitude2 ) * sampling time span.
In this version, there are no method to show this values except log file named as EN-yyyyMMdd-HHmmss.txt in CSV. The first column is date and time. The seconds is relative time in nano seconds. The 3rd is the value. I don't know the theories of vibration energy and human activities, so I can not say anything, but I think this values are related to the human activities. Please enjoy by your intellectually inquiring minds!
※ I'm sorry, miss typing. Don't worry, the source is correct. Anyway, the sampling time span is not always same value, so I think using Energy is not rational. In the next version, I'll change it to Power that is not multiplied by time.
Values of current, max, min and average for each axis in recent 1024 data points. Usually the major sampling rate of acceleration is 50Hz so the time span of this table is 20seconds.
List of important informations for scientific purpose. You can see the following values in this list.
Status of Recoring. WV:Wave, SP:Spectrum, WF:Waterfall display and EN:Energy. You can check which elements are loged. You can start/stop by tapping this strings.